Unmap: Undo bad data representation
I recently gave a talk at my department's graduate student seminar about data visualization best practices. A major part of that talk focused on good and bad colormaps for representing multidimensional data. As part of putting together my slides, I made lots of figures to compare visualization styles for multidimensional data. I eventually ended up putting together a tool to undo the colormap in published figures, to manipulate them directly as digital data, and to replot them in another color scale.
Introducing Unmap, the simple Python tool for digitizing color-mapped figures. The original point of this tool was to undo the damage caused by the Jet colorscale, but it turns out to be useful beyond its intended purpose. Background on why to dislike Jet is covered in depth elsewhere, including an excellent talk by Nathaniel Smith and Stéfan van der Walt, which initially got me interested in the subject.
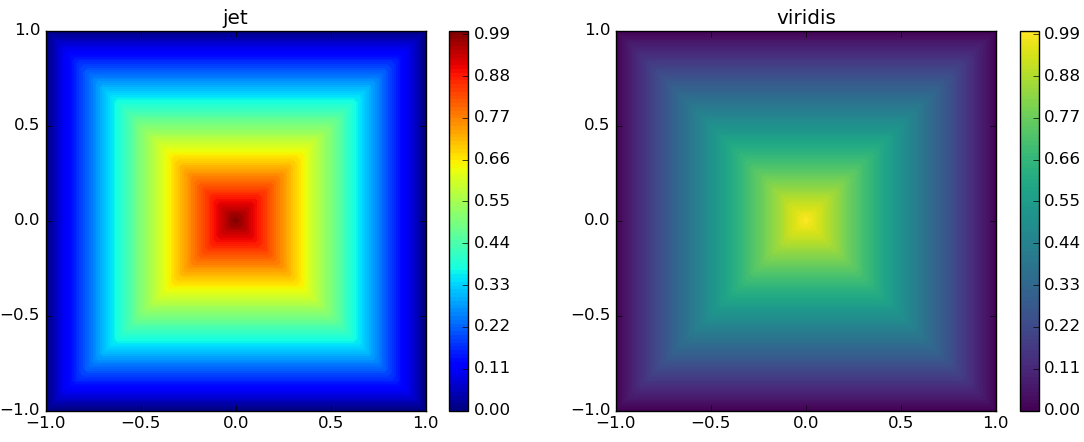
In short, Matlab's default color scale for plotting multidimensional data (as images, mostly) was, until recently, a rainbow-ish scale called "Jet". Jet has several fatal problems that make it unfit for accurately representing most data to which it is applied. Specifically, it's not uniquely interpretable by colorblind people, it does not map well to black and white (for printing), and humans do not perceive it as a linear scale. These problems lead to (mostly) unintentional misrepresentations of data, which can mislead readers, and even ones self when interpreting new information. Of course, better colormaps exist (Borland et al., 2007). Even Matlab has moved to a colorscale that better accomplishes the three criteria listed above.
Borland, D., and Ii, R.M.T., 2007, Rainbow Color Map (Still) Considered Harmful: IEEE Computer Graphics and Applications, v. 27, p. 14-17, doi: [10.1109/MCG.2007.323435](https://doi.org/10.1109/MCG.2007.323435).
Gao, H., Humphreys, E.D., Yao, H., and van der Hilst, R.D., 2011, Crust and lithosphere structure of the northwestern U.S. with ambient noise tomography: Terrane accretion and Cascade arc development: Earth and Planetary Science Letters, v. 304, p. 202-211, doi: [10.1016/j.epsl.2011.01.033](https://doi.org/10.1016/j.epsl.2011.01.033).
Zabala-Travers, S., Choi, M., Cheng, W.-C., and Badano, A., 2015, Effect of color visualization and display hardware on the visual assessment of pseudocolor medical images: Effect of color and display on visual assessment: Medical Physics, v. 42, p. 2942-2954, doi: [10.1118/1.4921125](https://doi.org/10.1118/1.4921125).